KPI and finance dashboard video templates
The point is not the animation. It is that $2.4M reads $2.4M — same layout, same type, every quarter, without a designer or a timeline.
8 templates · one-time licence · unlimited exports · rendered in your browser
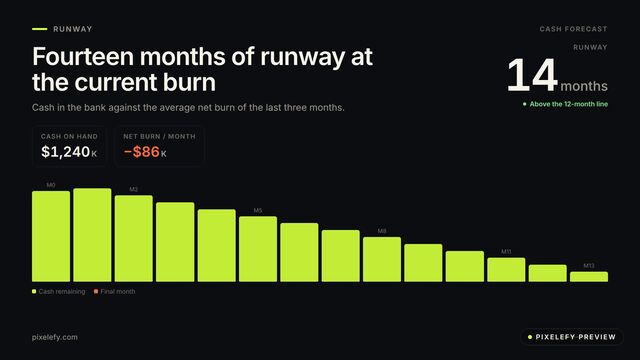
Cash on hand against monthly burn, with the month the money runs out.
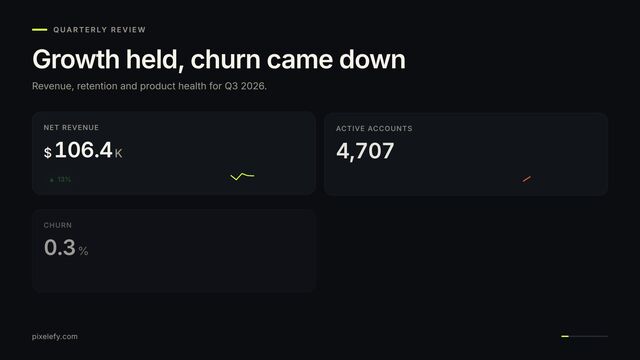
Four headline metrics with count-up numbers and sparklines.
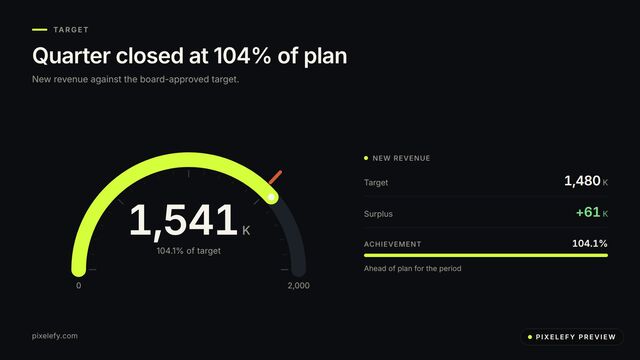
One number against its target on a dial, so a single result reads at a glance.
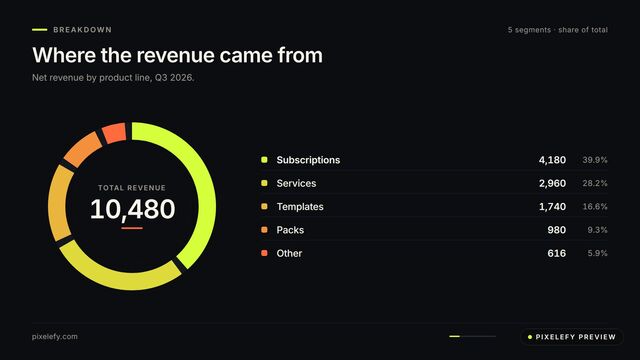
How a total splits across up to six parts, with the share of each stated.
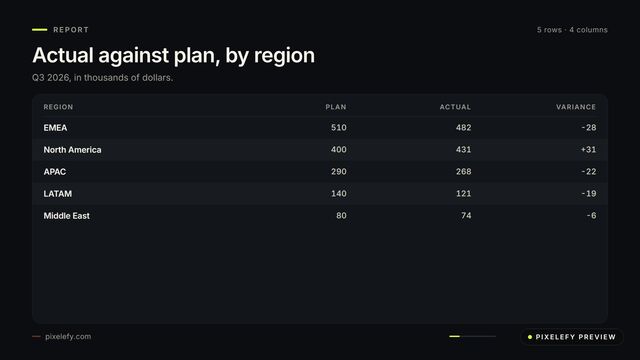
A real report table, rows arriving one by one — for the numbers a chart cannot carry.
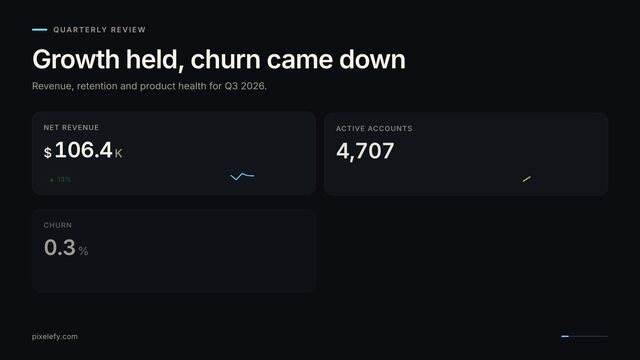
Six tiles with a status lamp each: the numbers a board argues about, nothing else.
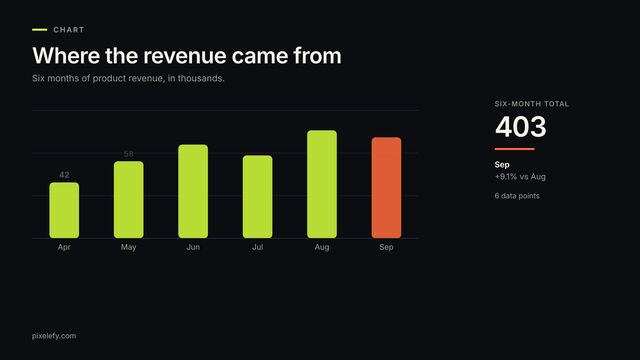
Paste two columns from a spreadsheet; get an animated bar chart with a total.
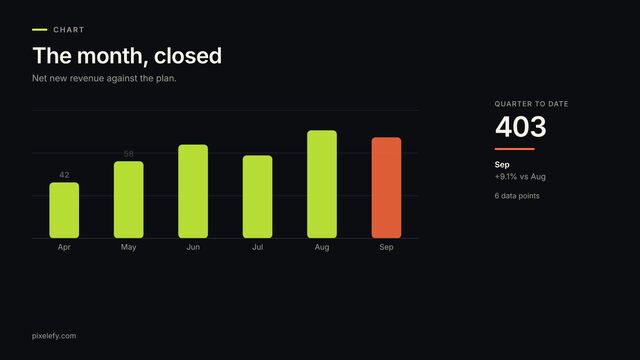
Diverging bars around the plan line: the miss and the beat, in percent.
Tick any two templates in the catalogue and the price falls as you add.