Video templates you edit, not just watch
Every template here renders in your browser: you type your own numbers, names and colours, and export an MP4 in 1080p or 4K. Nothing is uploaded, no subscription, one payment per licence and unlimited exports.
Start from the kind of video you need below, or open the full catalogue and price a set.
These are the videos that go in front of a number that has to be right: a quarterly result, a board pack, a mo...
Funnels, cohorts and rankings, the three ways a sales story is usually told. Each one takes a spreadsheet colu...
The charts a growth team argues with: an MRR bridge that shows what actually moved, a unit-economics screen wi...
Numbers that do not survive being approximated: p95 latency against a budget, cost per million tokens against...
Where the work gets reported: objectives with owners and progress, headcount by team, the totals a quarterly r...
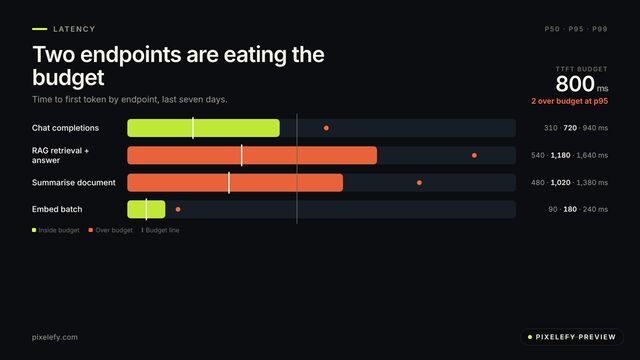
p50 / p95 / p99 per endpoint against one latency budget, breach flagged in colour.
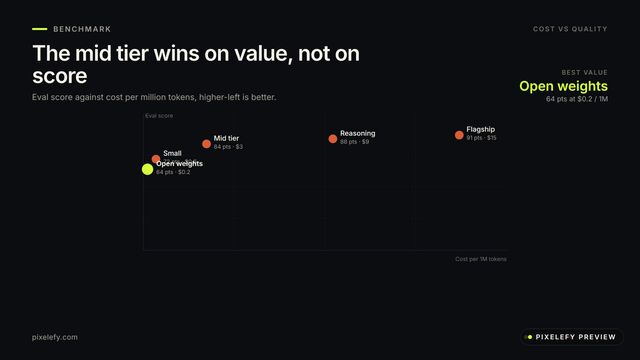
Models plotted on cost per million tokens against eval score, best value called out.
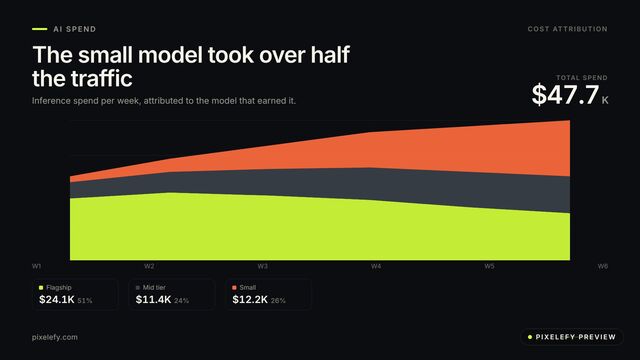
Stacked spend per model over the weeks, with each model's share of the bill.
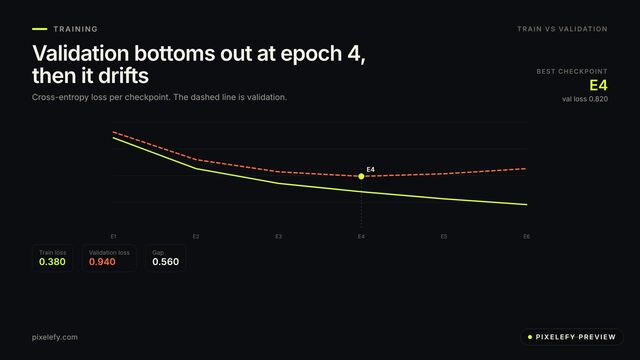
Training against validation loss per checkpoint, with the best checkpoint called out.
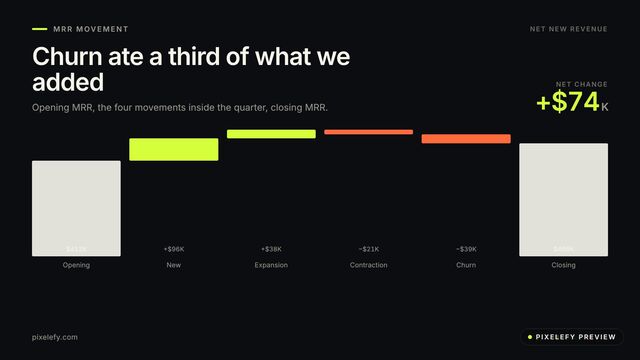
New, expansion, contraction and churn as a bridge from opening to closing MRR.
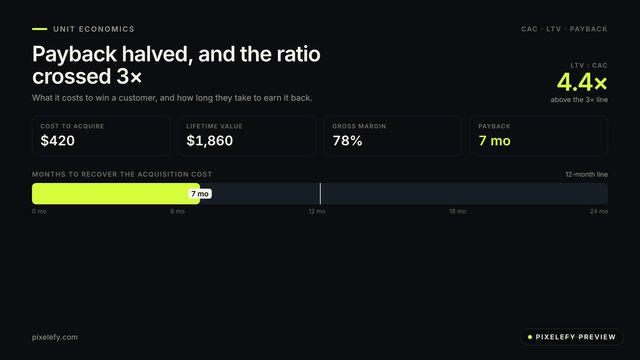
CAC, LTV, margin and payback on one screen, with the months-to-payback ruler.
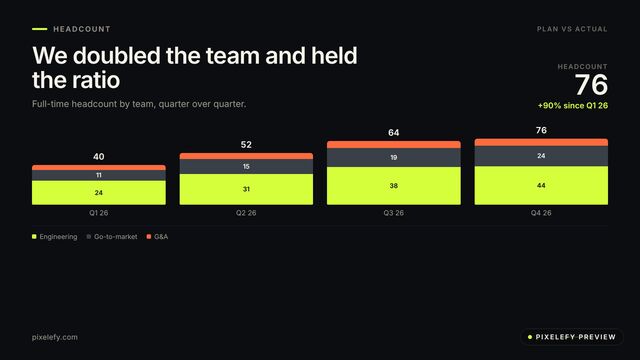
Headcount per quarter stacked by team, with the total and the growth since the first quart...
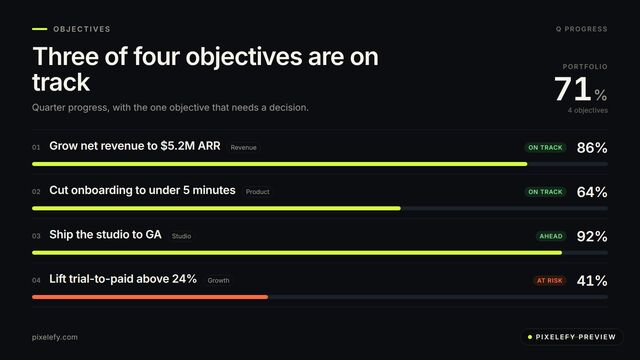
Objectives with owners, progress bars and a portfolio number — for a quarter review.
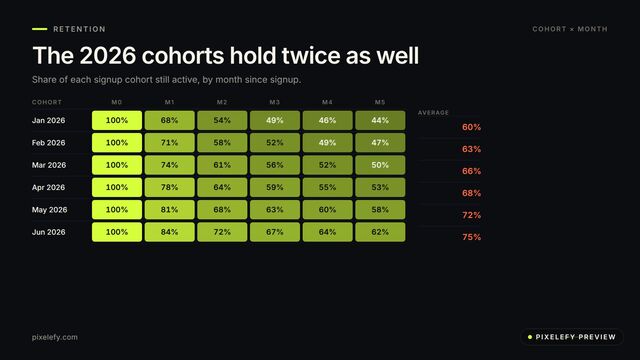
Monthly cohorts down the side, months since signup across the top, retention in each cell.
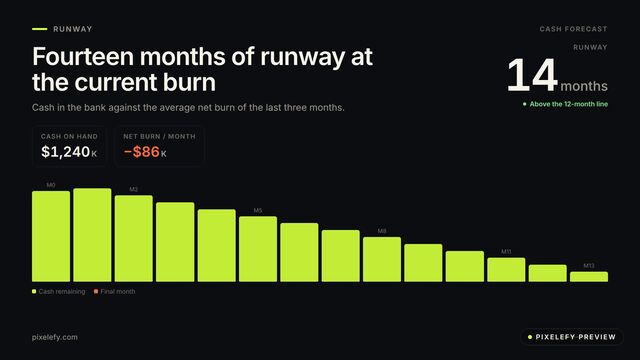
Cash on hand against monthly burn, with the month the money runs out.
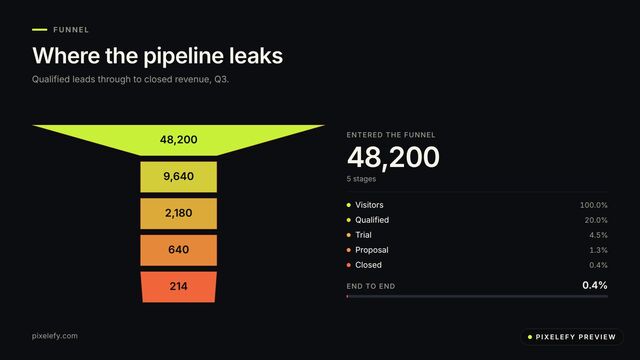
Conversion through the stages of a pipeline, with the drop between each one stated.
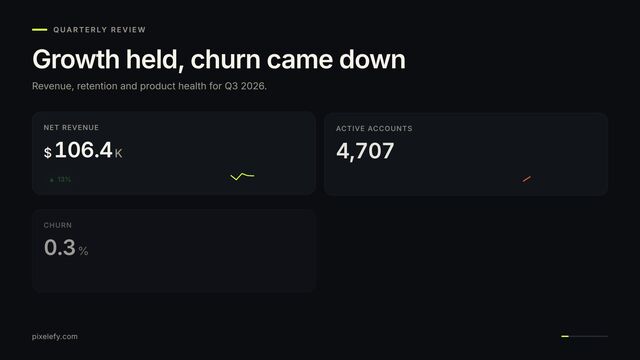
Four headline metrics with count-up numbers and sparklines.
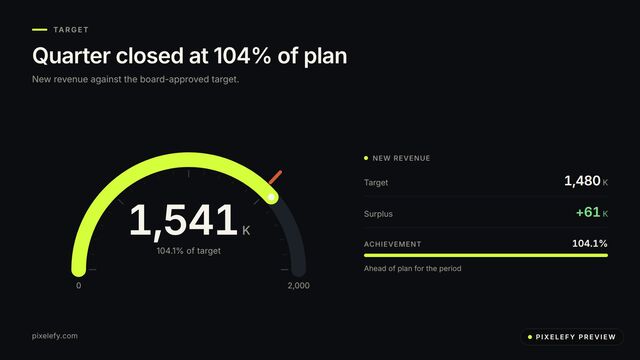
One number against its target on a dial, so a single result reads at a glance.
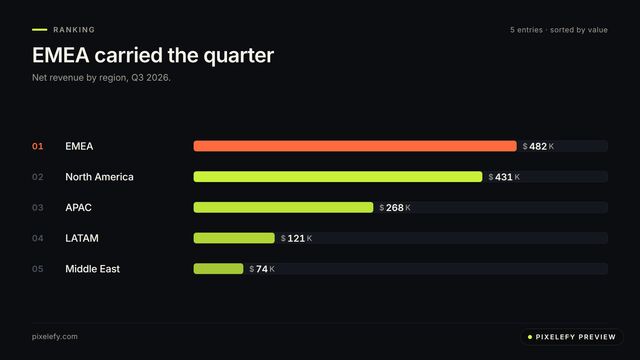
A ranked list of anything measurable — regions, products, owners — as growing bars.
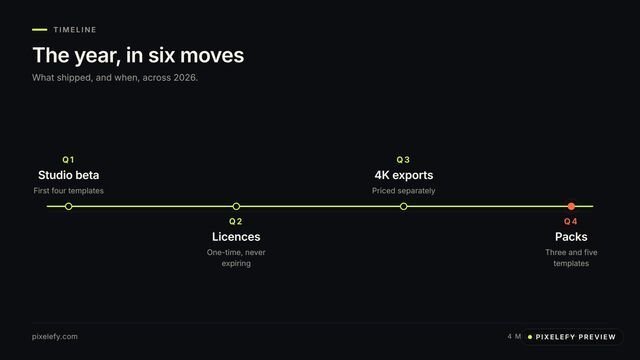
Milestones along a timeline, for a roadmap, a release history or a project plan.
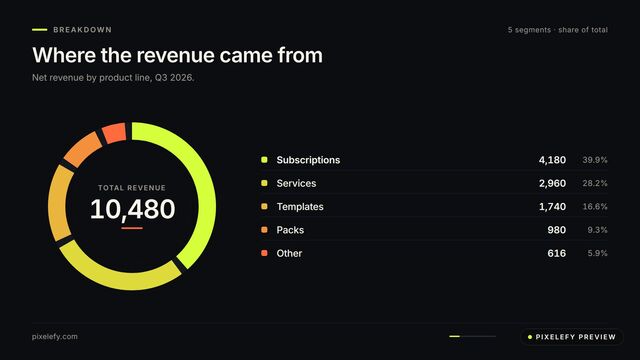
How a total splits across up to six parts, with the share of each stated.
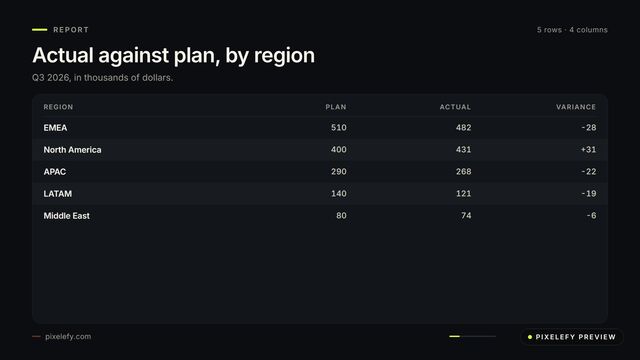
A real report table, rows arriving one by one — for the numbers a chart cannot carry.
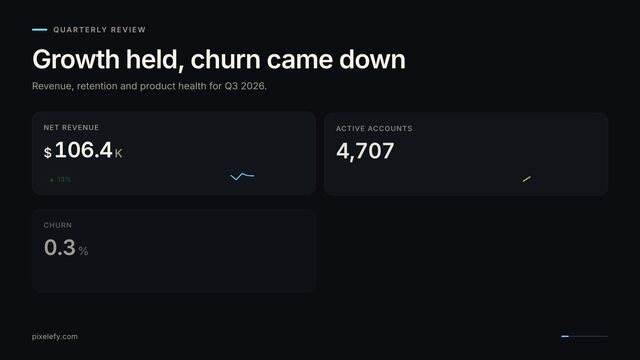
Six tiles with a status lamp each: the numbers a board argues about, nothing else.
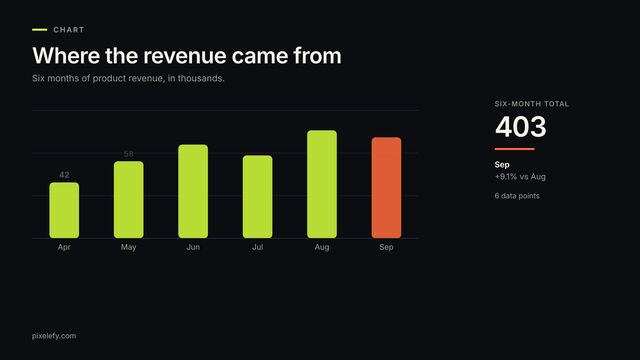
Paste two columns from a spreadsheet; get an animated bar chart with a total.
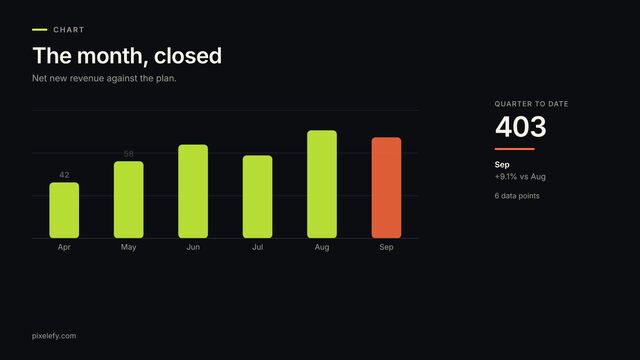
Diverging bars around the plan line: the miss and the beat, in percent.
Tell us the numbers you need on screen and we will say which template fits — or quote a custom one.